


Australian House Price Speculators: What Were You Thinking?
Past performance is not indicative of future results

Scott McNealy, the co-founder of Sun Microsystems, delivered the burial rites for the dot-com bubble with a quote that should be chiselled into the marble of big bank headquarters and the RBA board room.
Assessing his company’s own ludicrous stock price, he said:
At 10 times revenues, to give you a 10-year payback, I have to pay you 100% of revenues for 10 straight years in dividends. That assumes I can get that by my shareholders. That assumes I have zero cost of goods sold, which is very hard for a computer company. That assumes zero expenses, which is really hard with 39,000 employees. That assumes I pay no taxes, which is very hard. And that assumes you pay no taxes on your dividends, which is kind of illegal. And that assumes with zero R&D for the next 10 years, I can maintain the current revenue run rate. Now, having done that, would any of you like to buy my stock at $64? Do you realize how ridiculous those basic assumptions are? You don’t need any transparency. You don’t need any footnotes. What were you thinking?
What were you thinking? The question hung in the air over the ruins of Silicon Valley in 2002. And it’s a question one feels compelled to ask today, not of tech speculators, but of every Australian couple bidding with religious fervour at a coffee-cart adorned driveway auction.
The mathematics of finance are, after all, brutally indifferent. Whether you’re buying a share in a tech company or the title to a three-bedroom brick veneer in Parramatta, the price you pay is inexorably linked to the returns you can expect. For stocks, this is obvious. Analysts pore over revenues and earnings, and the market understands that if a stock’s price doubles without any change in the underlying business expectations, the future expected return has just been halved.
Yet in Australia, our national obsession with residential property seems to operate in a parallel universe, governed by its own magical laws. Nightly news bulletins breathlessly cheer on record prices, and the collective wisdom dictates that the phenomenal returns of the past will simply continue, regardless of the price paid today. Higher prices, it seems, are not a sign of lower future returns, but a validation that even higher returns are just around the corner.
But a house, for all its emotional and cultural baggage, is a financial asset. Its fundamental mathematics are undeniable, even if they are rarely calculated on the manicured nature strip of a Saturday auction. In the spirit of Scott McNealy, let’s peel back the layers of this great Australian church and ask a few fundamental questions.
Deconstructing the Golden Era: The 7.5% Triumph
The headline figure is impressive enough to be brandished by every vested interest in the media-property-industrial complex. From 1973 to 2024, Australian house prices delivered a total of 7.5% per annum. A triumph. Case closed, surely?
Not so fast. Let’s break that number down.
The first, most obvious villain is inflation. Over that same 50-year period, the average rate of inflation was 4.94% per annum. Strip that away, and the real, inflation-adjusted return on housing was a far more modest 2.5% per annum.

So, where did this real return come from? The “earnings” of a residential property can be measured by the rent it can generate (or the rent a homeowner avoids paying). Over the same half-century, rents rose by 5.09% per annum – almost perfectly in line with inflation. In real terms, the fundamental earning power of a house has barely budged.
The numbers are stark. The asset price grew in real terms by 2.5% a year, while the asset’s earnings (rent) had virtually zero real growth. This leaves a gaping chasm of 2.5% per annum that represents the "multiple expansion" of Australian housing. For 50 straight years, the price-to-rent ratio of the median Australian house has continued to rise. To use the share market analogy, the P/E ratio of 'Australia Housing Pty Ltd.' has been on a five-decade bull run.
Of course, a small portion of this price growth reflects genuine improvement. The median 1973 house is not the median 2024 house; we’ve paid for extensions, better kitchens, and an extra bathroom. But it doesn't account for the chasm. The overwhelming driver of that 2.5% annual expansion wasn't better houses; it was something else entirely. Something far more powerful.
The Rocket Fuel: How We Learned to Stop Worrying and Love Debt
If the price of housing has outstripped its fundamental return (rent) for 50 years, what was filling the gap? The answer is simple: borrowing power. The price of a house isn't what it's "worth" in a vacuum; it's what the marginal buyer can convince a bank to lend them.
And for 50 years, the capacity of Australians to borrow has been supercharged by a confluence of economic and social forces that are nothing short of a historical anomaly. My own modelling shows that from 1973 to today, the maximum borrowing power of a household grew by an astonishing 7.5% per annum – a figure that almost perfectly aligns with the 7.5% growth in house prices.
This rocket fuel was a cocktail of four key ingredients:
Falling Interest Rates: This is the big one. In the early 1970s, mortgage rates were high, and by the late 1980s, they were an eye-watering 17-18%. Today, even after recent hikes, they sit in the mid-single digits with recent home buyers speculating on lower rates. This secular decline in the cost of money from generational highs to generational lows was a one-off gift that massively inflated the present value of future incomes, allowing for astronomically larger loans. My model starting date of 1973 reduces the overall effect somewhat as interest rates were only 7.5% and the great interest rate rises of the late 1970s and 1980s had yet to begin.
The Second Income Revolution: In 1973, the standard household for mortgage purposes had one primary income earner. Today, the 1.6-full time-income home buyer is the norm on average. This societal shift almost doubled the income base upon which banks would calculate serviceability, providing a step-change in borrowing capacity that can never be repeated.
Longer Mortgage Lengths: A mortgage in the 1970s and 80s was typically 20 years. The standard is now 30 years (some lenders offering longer!). This extension, while seemingly minor, amortises the principal over a longer period, reducing monthly repayments and allowing for a larger initial loan.
Real Wages Growth: Underpinning all of this was strong nominal wage growth, which averaged 5.86% per annum over the period. Consistent real wage growth boosted borrowing power and gave confidence that the burden of a loan would inflate away over time.
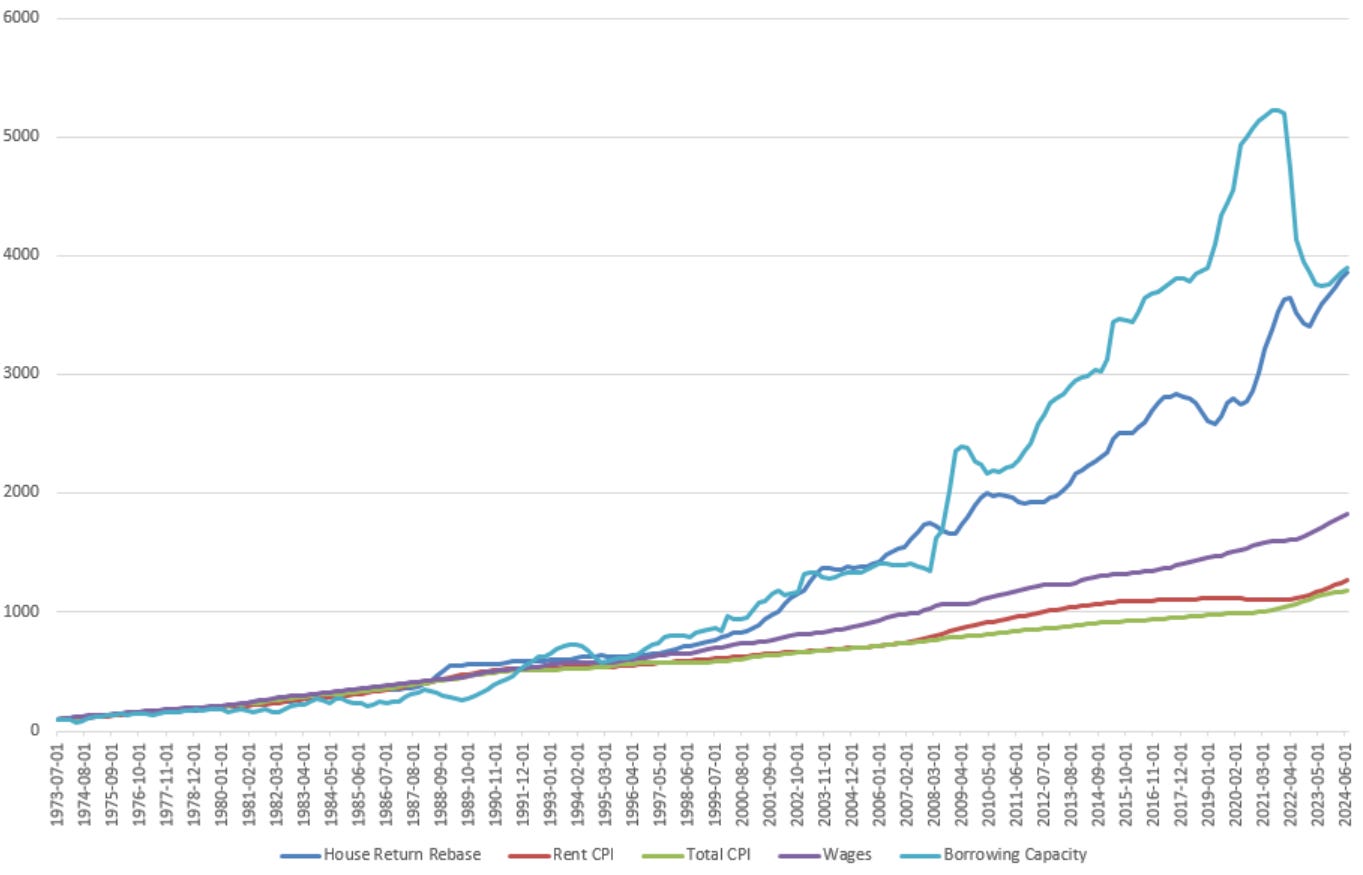
This combination was explosive. As my model shows the combination of real wages growth, move to dual incomes, the extension of loan terms and the fall in interest rates increased borrowing power by 7.5% per annum, creating the massive fuel for house price growth that has underpinned the last 50 years:

I’m not the first to point out the uncanny relationship between house prices and borrowing power, see the model below by AMP’s Shane Oliver who shows that the increase in housing prices is closely matched by the increase in borrowing power of a borrower under the conditions shown below:

My own model mimics the AMP numbers almost exactly, when I constrain the borrowing power to a single borrower:

However, when multiple borrowers are added to the model over time culminating in 1.6 full-time incomes per household, the borrowing power increase is enormous:
The Fuel Tank is Empty: What Now?
This brings us to the uncomfortable, McNealy-esque question for today’s buyer. If the last 50 years of returns were driven by this unrepeatable expansion of borrowing power, what will drive the next 50?
Let's examine the fuel tank.
Interest Rates: They cannot fall from 18% to 0.1% again. The tailwind is now, at best, a gentle breeze and, at worst, a headwind. Perhaps APRA will decrease or eliminate the 3% home-loan serviceability buffer - will we throw away prudential lending standards at the alter of higher prices?
Household Incomes: We are already a dual-income society. Are we banking on a third or fourth earner moving into the granny flat to service the mortgage? Is polygamy to become the new mandate that is needed for house prices to “sustainably grow”, as is current Federal Government policy?
Loan Terms: Will we see Japanese style 40-year or 50-year mortgages? Not likely considering it the average age of a first home buyer is now well into their 30’s.
The rocket fuel is gone. The only significant driver left is wage growth. And with current wage growth of 3.8% and declining, the outlook is fundamentally altered. The expectation that house prices can continue to grow at 7%, 8%, or 10% per annum forever requires a belief that the fundamental factors which underpinned this prior growth exist into the future and they simply do not.
The high priests of property will point to other factors: government schemes like Help to Buy, the wave of foreign buyers, or chronic supply shortages. And these are real factors. But they are merely tinkering at the edges. A government scheme that helps a few thousand people is not the same as a structural change that allows every household in the country to borrow more. A supply shortage may put a floor under prices, but it cannot, by itself, generate the kind of capital growth we have come to see as a birthright.
This is not a prediction of a crash. It is a prediction of a fundamental change in character. The era of housing as a speculative get-rich-quick scheme, powered by the ever-expanding balloon of debt, is likely over. The future of Australian housing is one where returns are tethered, for the first time in a generation, to the fundamentals: the sluggish growth of rents and wages. Some regions or cities will do better than others. The price increase in South East Queensland at the expense of stagnating Melbourne as mass interstate migration has occurred since the pandemic is proof enough. But to assume that home prices in aggregate will mimic the past is a step too far.
There is no shortage of highly leveraged speculators who have significant negative cash flows servicing jumbo property loans. There are endless ads on social media with financiers and buyers agents plugging 7-10% annualised future returns into “calculators” showing what a sure bet leveraging to the maximum and buying as many properties as possible is. There is a whole shelf dedicated in the Finance section of your local bookstore to this strategy. The soothing balm for this kind of speculation, which has been highly successful for the last 50 years, has been that the capital growth has far outstripped the tax deductible negative cash flow. To them we must ask, in the spirit of Scott McNealy:
You are betting that the unrepeatable miracle of the last 50 years is, in fact, repeatable. You are betting on another collapse in interest rates, another revolution in household formation, mortgages reaching entire working life lengths and a return to booming wage growth that is nowhere in sight. Do you understand the assumptions you are making?
What were you thinking?
This was a great read, thank you. I’m based in Auckland which as I’m sure you are well aware has similar ‘propadee’ market characteristics!
I read a very similar take 15 years ago 😅